Bookmap settings reference
This page covers the Pulling & Stacking Indicator on Bookmap, where it runs as an add-on, with its flow panel under the heatmap.
Open the settings from Settings → Configure add-ons, then select Pulling & Stacking Indicator. Settings are saved per instrument.
Settings marked with * are saved straight away but only take effect after you
click Apply core settings changes and restart indicators. The restart keeps
the flow engine's history, so the warm-up of the flow lines does not start
over. In Buy / Sell mode the Buy / Sell band does warm up again, over one
primary window (five minutes by default), and the restart clears the
instrument's log in the console (see Apply).
Licence
The Licence section is at the top of the settings in the version bought on sigmantra.com. The Bookmap Marketplace version has no Licence section and needs no licence key. See activate your licence.
Until the Terms and Conditions are accepted, the Licence section reads
Accept the Terms and Conditions first (below). Then enter your licence key and tick Activate Licence.
with an empty Licence Key, also on a computer where your licence is already
active. There, accept the terms only: the status line then shows
Licence active on this computer. without the key being entered again.
| Setting | Meaning | Default |
|---|---|---|
| Licence Key | Paste the key from your subscription email (it starts with lic_), then tick Activate Licence. Greyed out while the licence is active on this computer, when it shows only the start of the key. The key is kept for this computer, not in the Bookmap workspace. |
Empty |
| Activate Licence | Tick to activate the licence key above on this computer. While the licence is active the box stays ticked and greyed out. If the terms are not accepted yet, the indicator asks you to accept them first and activates the key as soon as you do. | Off |
| Status line (under Activate Licence) | What the licence is doing on this computer, for example Licence active on this computer. It has no label of its own. Read only. |
|
| Release This Computer | A button: click it and confirm to stop using your licence on this computer, so you can activate it on another one. The indicator stops on every platform on this computer that uses the licence. See release this computer. |
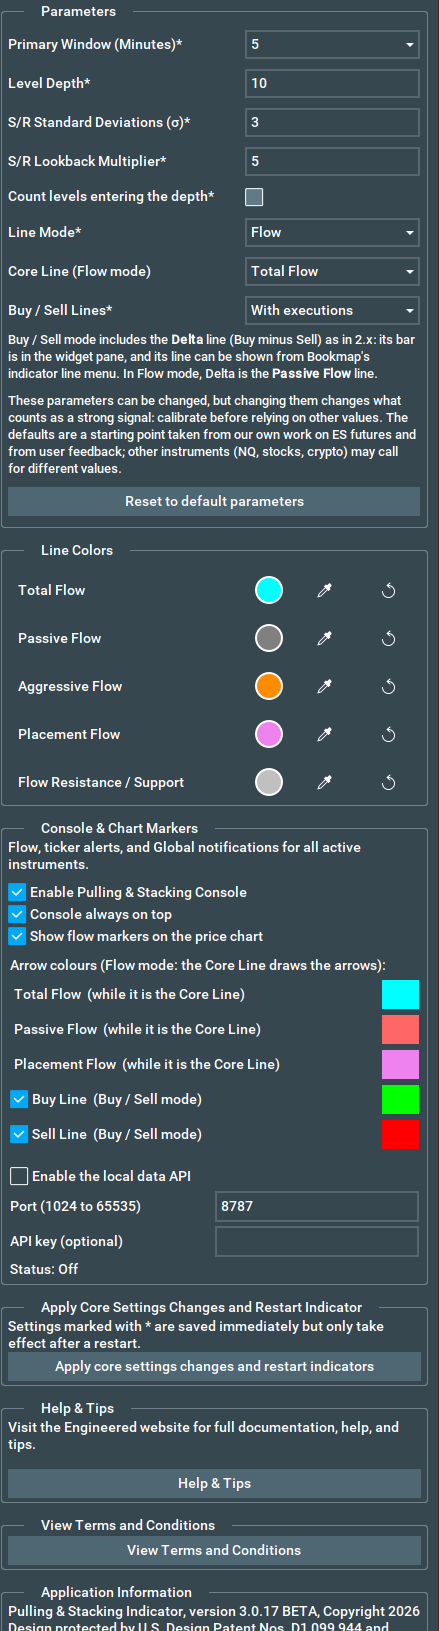
Parameters
| Setting | Meaning | Default | Range |
|---|---|---|---|
| Primary Window (Minutes)* | The window that drives the chart lines and the console headline. The console ladder always shows all four windows. | 5 | 2, 3, 5, 10 |
| Level Depth* | How many bid and ask price levels pulling and stacking is measured across, for every line and the console. It also affects how often the deep-book warning appears. | 10 | 1 to 100 |
| S/R Standard Deviations (σ)* | Width of every Resistance / Support band (Flow and Buy / Sell) in standard deviations of the line over the lookback. | 3 | 1 to 10 |
| S/R Lookback Multiplier* | Lookback of every band, and of the warm-up, as a multiple of each flow window. 5 × the 5-minute window looks back 25 minutes. | 5 | 1 to 20 |
| Count levels entering the depth* | How a price level that moves into the top Level Depth levels is treated. Off: it is matched against the whole previous book, so a level that was already resting just outside the depth adds only its change in size. On: it is matched against the previous top levels only, so its full size counts as newly stacked liquidity each time price moves it into range. On gives larger, more price-driven readings; it is the classic pulling-and-stacking rule. Default: Off: with it on, the lines tend to read against a strong move in progress. Charts and settings saved with an earlier build keep their value; untick the option or use Reset to default parameters. It also affects how often the deep-book warning appears. | Off | |
| Line Mode* | Which family of lines the chart plots: Flow or Buy / Sell. See line modes. | Flow | |
| Console Mode | What this instrument's console tile and its alerts read: Same as chart, Flow (the Core Line) or Buy / Sell (the pair of the Buy / Sell Lines setting). The chart's lines, band and arrows always follow Line Mode. Applies at once. See Console Mode. | Same as chart | |
| Core Line (Flow mode) | The line you trade from: Total, Passive or Placement Flow. The band is sized from it, and the arrows, the console and the alerts read it. It is also the line a Flow console reads on a Buy / Sell chart (Console Mode Flow), so it is listed in every line mode. Applies at once; the band steps on the chart where you changed it. See Placement Flow & the core line. | Total Flow | |
| Buy / Sell Lines* | With executions (the classic lines) or Placement only (each trade added back to the side it consumed). The Delta Line follows: Passive Flow with executions, Placement Flow for placement only. See buy & sell lines. | With executions |
Beneath the parameters the panel notes that Buy / Sell mode includes the Delta Line (its bar in the widget pane, its line shown from Bookmap's line menu) and that in Flow mode Delta is the Passive Flow line ("as in 2.x" there, and in the Buy / Sell Lines help, refers to version 2 of the indicator, which had the same Delta line and the same With executions Buy and Sell lines), carries the calibration note, and has a Reset to default parameters button (Primary Window 5, Level Depth 10, S/R Standard Deviations 3, S/R Lookback Multiplier 5, Line Mode Flow, Console Mode Same as chart, Core Line Total Flow, Buy / Sell Lines with executions); the reset takes effect after Apply core settings changes and restart. Read calibrating the parameters before changing them. Resistance and Support lines are always on in every mode.
Line Colors
One colour picker per line of the saved Line Mode. The eyedropper picks a colour from the screen and the arrow resets to the default. Colour changes apply immediately, without a restart.
| Mode | Lines listed | Default colours |
|---|---|---|
| Flow | Total Flow, Passive Flow, Aggressive Flow, Placement Flow, Flow Resistance / Support | Cyan, grey, orange, light magenta (#EE82EE, which looks pink), light grey |
| Buy / Sell | Buy Line, Sell Line, Delta Line, Buy/Sell Resistance / Support | Green, red, white, light grey |
Console & Chart Markers
| Setting | Meaning | Default |
|---|---|---|
| Enable Pulling & Stacking Console | Shows the shared console window and opens it when the indicator loads. Untick to hide it. Closing the console window unticks it. | On |
| Console always on top | Keeps the console above other windows, including Bookmap's own dialogs. Applies immediately. | Off |
| Show flow markers on the price chart | Master switch for the arrows on the heatmap. When off, no line draws arrows. | On |
| Arrows: green up = bullish, red down = bearish | The arrow colour and direction show the market reading, whichever line drew it (see the console). There are no arrow colour settings. The full label reads "Arrows: green up = bullish, red down = bearish (Flow mode: the Core Line draws the arrows):"; Bookmap's panel may cut off its end. | |
| Total / Passive / Placement Flow (while it is the core line) | In Flow mode the core line draws the arrows, so these rows have no tick box. | |
| Buy Line / Sell Line (Buy / Sell mode) | Tick the lines that should draw an arrow when they cross outside Buy/Sell Resistance / Support. | Both on |
| Enable the local data API | Serves the line values to programs on this computer. See local data API. Applies at once. The note under it reads: "The local data API is not available for instruments whose data licence allows display in Bookmap only (for example, real-time CME data from Bookmap). The indicator works as usual on those instruments; only the API leaves them out." See instruments the API leaves out. | Off |
| Port | The port the local data API listens on (1024 to 65535). | 8787 |
| API key (optional) | If set, a program must send it in the X-API-Key header. Letters, digits, - and _. |
Empty |
| Status | Whether the API is listening, and where, and which loaded instruments it leaves out, for example Listening on http://127.0.0.1:8787/v1/flow. Not available for INSTRUMENT (display-only data licence). |
Apply Core Settings Changes and Restart Indicator
The Apply core settings changes and restart indicators button applies every
setting marked * for this instrument and restarts the indicator on it. Other
instruments keep running, and the flow engine of this instrument keeps its
warm-up; only the chart lines are re-registered. Two things do start again, here
and when you untick and tick the indicator in Configure add-ons:
- In Buy / Sell mode, the Buy / Sell band warms up again over one primary
window (five minutes by default); the console tile shows
WARMING UP 1% - 5 min bandagain. - The instrument's tile log in the console starts empty. When no other instrument has the indicator running, the console closes and opens again and the Global notifications log starts empty too.
Help & Tips
The Help & Tips button opens the Sigmantra website in your browser, for the documentation, help and tips.
View Terms and Conditions
Reopens the Terms and Conditions.
Application Information
The installed version, copyright, and patent marking.
Showing and hiding individual lines
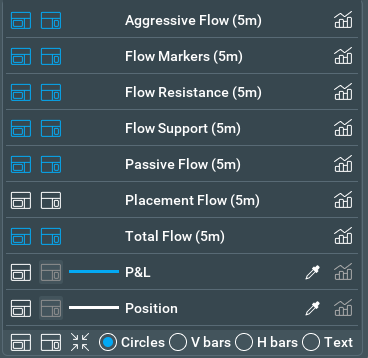
Line visibility is not in this panel. Use the gear at the top of the indicator widget pane on the chart: each line of the current mode has one button for the line in the panel and one for its widget. Placement Flow is listed there and starts hidden. The menu also lists Flow Markers (5m) (the number is the primary window): it draws no line, and is where the indicator draws its arrows on the price chart, so leave it shown. Show flow markers on the price chart in this panel switches the arrows on and off.
Next: local data API
Chart images. The chart images on this site show the indicator's display on market data, to explain what it draws. They are not trading results or trade recommendations, and the risk and hypothetical performance disclosures above apply to them. We publish no trading performance. The full text is on the disclosures page.