Classic ATAS settings reference on ATAS (Classic)
This page covers the Pulling & Stacking Indicator on ATAS (Classic), where it runs as an indicator, in its own panel under the price chart.
Open the indicator's settings: click Indicators in the chart's toolbar and select Pulling & Stacking Indicator in the list of added indicators. Change a setting, then click Apply (if the window stays open, click Apply again). ATAS cuts long setting names, so the settings show short names; hold the pointer over one to see its full name, the one used in the rest of these pages, and what it does. The tables give both.
ATAS starts the indicator again whenever you apply its settings. The flow engine keeps running across it, so most changes keep the warm-up, the lines already drawn, the arrows and the console log; changing Depth or New Levels starts the warm-up again, and changing Lookback × warms the bands again over their lookback. Cancel after you have edited values starts the warm-up again; Cancel without edits keeps it.
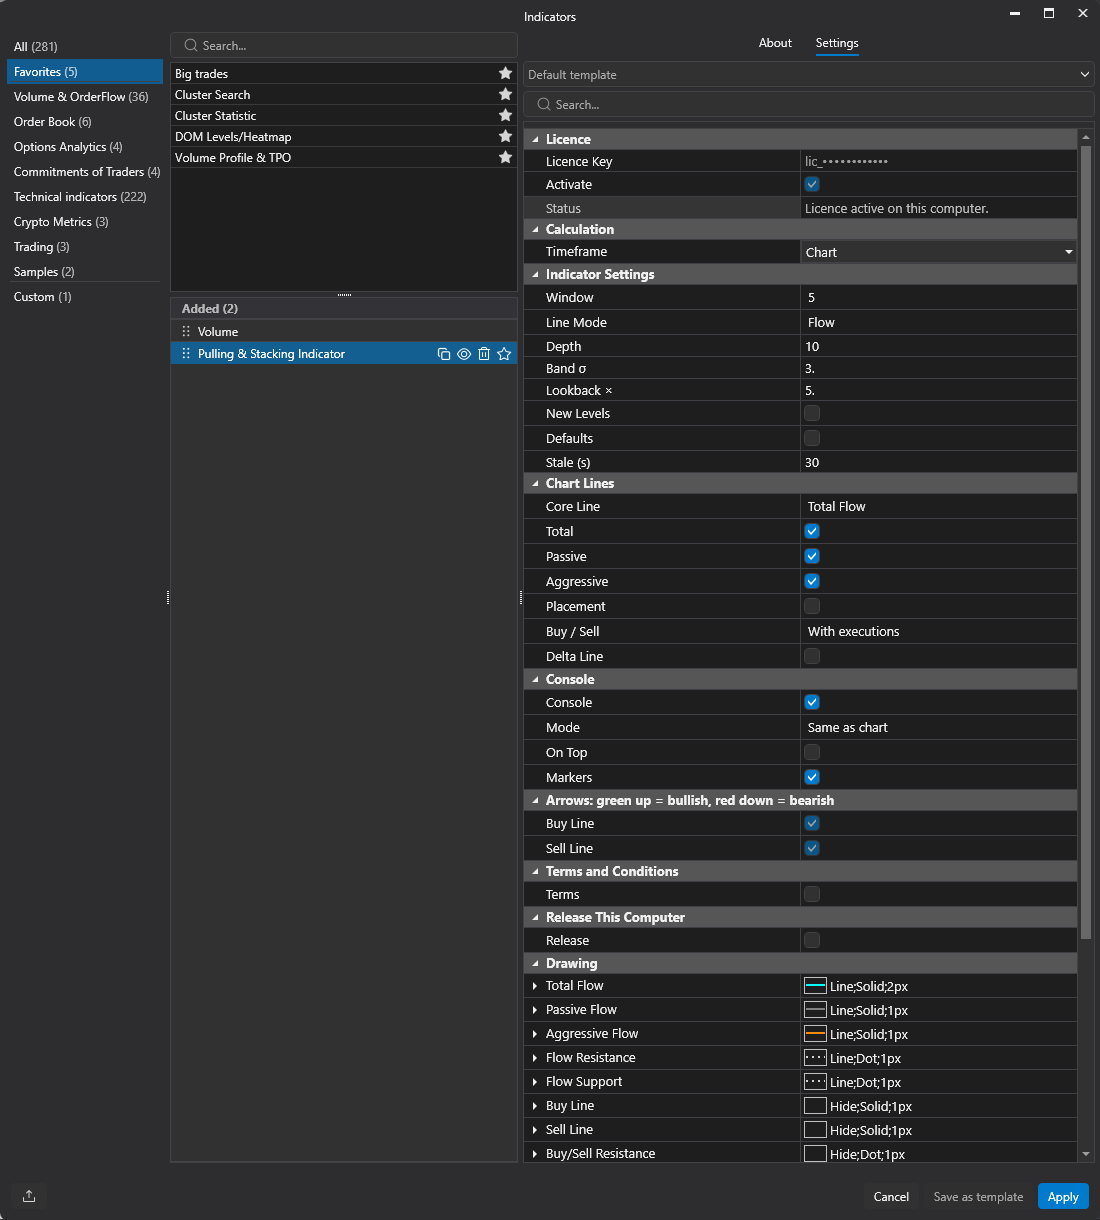
Licence
| Setting | Meaning | Default |
|---|---|---|
| Licence Key | Paste the key from your purchase email, then tick Activate. While the licence is active it shows only the start of the key followed by dots. | |
| Activate | Activate Licence: tick it and click Apply to activate the licence key above on this computer. While the licence is active it stays ticked. See activating your licence. | Off |
| Status | Licence Status: what the licence is doing on this computer, for example Licence active on this computer. Read only. |
Indicator Settings
| Setting | Meaning | Default | Range |
|---|---|---|---|
| Window | Primary Window (Minutes): which window drives the lines, the band and the alerts. | 5 | 2, 3, 5, 10 |
| Line Mode | Flow or Buy / Sell. See line modes. | Flow | |
| Depth | Level Depth: how many bid and ask price levels are measured. Changing it starts the warm-up again. It also affects how often the deep-book warning appears. | 10 | 1 to 100 |
| Band σ | S/R Standard Deviations: width of every Resistance / Support band. | 3 | 1 to 10 |
| Lookback × | S/R Lookback Multiplier: lookback of every band, and of the warm-up, as a multiple of each window. Changing it starts the bands' warm-up again. | 5 | 1 to 20 |
| New Levels | Count Levels Entering The Depth. Off: a price level that moves into the top Level Depth levels adds only its change in size. On: its full size counts as newly stacked each time price brings it into range, which gives larger, more price-driven readings. Changing it starts the warm-up again. | Off | |
| Defaults | Reset To Default Parameters: tick it and click Apply to go back to the defaults: Primary Window 5, Flow mode, Console Mode Same as chart, Total Flow, the default lines, Level Depth 10, 3 standard deviations, lookback 5. | Off | |
| Stale (s) | Stale After (Seconds): with no market data for this long, the console shows STALE. |
30 | 1 to 600 |
Chart Lines
| Setting | Meaning | Default |
|---|---|---|
| Core Line | Core Line (Flow mode): Total, Passive or Placement Flow. The band, the arrows and the console follow it. | Total Flow |
| Total / Passive / Aggressive / Placement | Show Total / Passive / Aggressive / Placement Flow: which Flow lines are drawn. | On, on, on, off |
| Buy / Sell | Buy / Sell Lines: With executions or Placement only. | With executions |
| Delta Line | Show Delta Line: Buy / Sell mode, draws Buy minus Sell, in white, with no band. | Off |
ATAS keeps a settings group of its own called "Lines" (an indicator's horizontal lines) at the bottom of every list, so the indicator's lines are in Chart Lines. ATAS also lists two items of its own that every indicator has: Calculation > Timeframe and Misc > Show description. They belong to ATAS, not to the indicator, and are described in ATAS's own documentation.
Console
| Setting | Meaning | Default |
|---|---|---|
| Console | Enable Pulling & Stacking Console: shows the shared console. Closing the console with its close box unticks it on every chart, and the console stays closed until you tick it again on a chart. | On |
| Mode | Console Mode: what this instrument's console tile and its alerts read: Same as chart, Flow or Buy / Sell. A Buy / Sell console on a Flow chart warms its band over the full lookback (25 minutes at the defaults). See Console Mode. | Same as chart |
| On Top | Console Always On Top: keeps the console above other windows. One setting for the one console: the chart where it was last changed or applied decides. | Off |
| Markers | Show Flow Markers On Price Chart: the master switch for the arrows. Arrow colours are fixed: green up is bullish, red down is bearish. | On |
Arrows: green up = bullish, red down = bearish
| Setting | Meaning | Default |
|---|---|---|
| Buy Line / Sell Line | Buy Line Arrows / Sell Line Arrows (Buy / Sell mode): which of the two lines draw arrows. They do nothing in Flow mode. | On, on |
Terms and Conditions
| Setting | Meaning | Default |
|---|---|---|
| Terms | Show Terms and Conditions: tick it to read the terms again. The terms window opens as soon as you tick it, without Apply. | Off |
Release This Computer
| Setting | Meaning | Default |
|---|---|---|
| Release | Release This Computer, near the bottom of the list: tick it and click Apply to stop using your licence on this computer. See release this computer. | Off |
Line colours
Line colours and styles are in ATAS's own Drawing settings for the indicator. A line that the chart does not draw (the other mode, or switched off) is hidden and shows no value. Each band has two entries there: the band itself (dotted, fully seeded) and the same band "(provisional)" (dashed). The defaults: Total Flow cyan, Passive Flow grey, Aggressive Flow orange, Placement Flow violet, Buy Line green, Sell Line red, Delta Line white.
The Drawing settings also list Scale margin (top) and Scale margin (bottom). They are two invisible lines, drawn in a fully transparent colour, that leave some room above and below the lines so the outer band and its value tag stay whole inside the panel. Leave them as they are: a visible colour draws them, and hiding them takes the room away.
Alerts
Alert thresholds are set in the console: the bell on the instrument's tile, and Global notification settings. See notifications. The default global threshold is 3σ.
Chart images. The chart images on this site show the indicator's display on market data, to explain what it draws. They are not trading results or trade recommendations, and the risk and hypothetical performance disclosures above apply to them. We publish no trading performance. The full text is on the disclosures page.