Placement Flow & the core line on Quantower
This page covers the Pulling & Stacking Indicator on Quantower, where it runs as an indicator, in its own panel under the price chart.
Placement Flow
Passive Flow is the change in the resting book. A trade removes resting size, so Passive Flow already contains the executions. Placement Flow takes them out:
Placement Flow = Passive Flow − Aggressive Flow
What is left is what traders placed and cancelled. It is the fourth line of the Flow mode and is hidden by default, so nothing changes until you switch it on.
One limit: a trade is added back at its full size. Size that traded from an iceberg or hidden order never showed in the book, so Placement Flow over-credits it by that amount.
Placement Flow is new in 3.0. Treat it as a way of looking at the book: context for your own judgement, not a signal to trade.
The core line
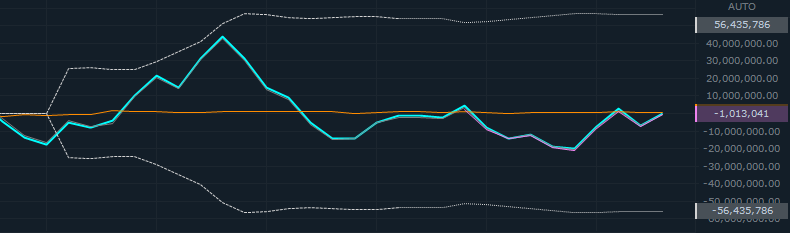
The core line is the line you trade from. Choose Total Flow (the default), Passive Flow or Placement Flow. Four things follow it:
- the Flow Resistance / Flow Support band, sized from that line's own variability,
- the price-chart arrows,
- the console headline, the four-window ladder and the per-window alerts,
- the global notifications.
The last two follow it whenever the console reads Flow: on a Flow chart with Console Mode Same as chart, or with Console Mode set to Flow, even on a Buy / Sell chart. See line modes.
The console tile names the line it is reading, so you always know which line a σ figure refers to.
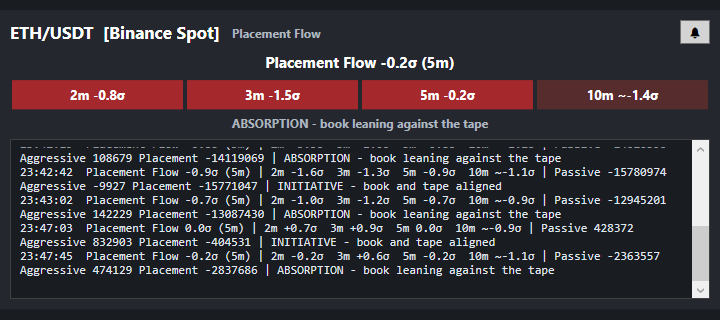
Why each line has its own band: the lines move by different amounts. Placement Flow can move much less than Total Flow, so read against Total Flow's band it may rarely reach either edge. Read against its own band, a σ figure is on the same scale whichever line you trade from.
Aggressive Flow is not offered as a core line.
Changing the core line
Set Core Line (Flow mode) in the indicator's settings; the change applies at once. It is used in every line mode, because a Flow console reads it on a Buy / Sell chart too. The lines already drawn keep the line they were drawn with, so the band steps where you made the change.
Showing and hiding lines
Tick or untick Show Total Flow, Show Passive Flow, Show Aggressive Flow or Show Placement Flow in the indicator's settings. Placement Flow starts hidden. A line switched on shows from the moment it is switched on; a line the chart does not draw is hidden and shows no value.
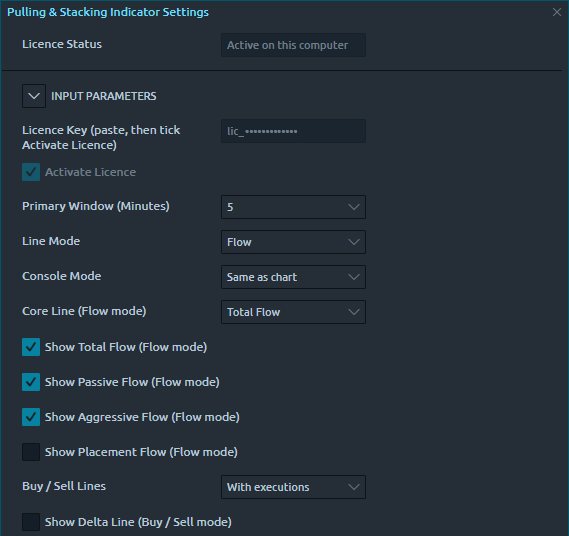
If you hide the core line, its band is hidden too and it draws no arrows.
In Buy / Sell mode
The Buy / Sell mode has its own choice, Buy / Sell Lines: With executions (the classic lines) or Placement only, where each trade is added back to the side it consumed. Buy Line minus Sell Line is Passive Flow for the first and Placement Flow for the second.
Next: line modes
Chart images. The chart images on this site show the indicator's display on market data, to explain what it draws. They are not trading results or trade recommendations, and the risk and hypothetical performance disclosures above apply to them. We publish no trading performance. The full text is on the disclosures page.