Getting started on Quantower
This page covers the Pulling & Stacking Indicator on Quantower, where it runs as an indicator, in its own panel under the price chart.
The indicator for Quantower is one file, PullingAndStackingIndicator.dll, for
Quantower 1.146 or later, on Windows. It needs a data connection that provides
market depth (Level II, the order book) and trades for the instrument. It works
on live data and on Quantower's Market Replay (see indicator states).
Install
- Download the Quantower zip from your Sigmantra account and unzip it. It
holds the DLL, a
.sha256file with the DLL's checksum, andINSTALL.md. The SHA-256 shown beside the download in your account is the hash of the zip itself; the.sha256file inside is the hash of the DLL. To check the file on Windows, runGet-FileHash PullingAndStackingIndicator.dllin PowerShell in that folder and compare the hash with the one in the.sha256file. PowerShell prints the hash in capital letters and the file has it in small letters: that is the same hash, only the letters' case differs. - Open the folder
Settings\Scripts\Indicatorsinside your Quantower installation (for exampleC:\Quantower\Settings\Scripts\Indicators). - Create a folder named
PullingAndStackingIndicatorthere if it is not already there, and copyPullingAndStackingIndicator.dllinto it. Replace the old file if Windows asks.
Quantower picks up the new file without a restart. To update the indicator later, replace the file the same way; if the console of the old version stays open, restart Quantower.
First chart
- Open a chart of the instrument you trade.
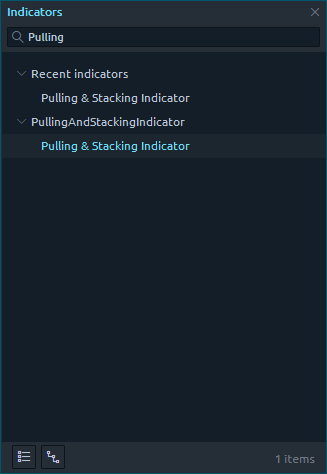
- Right-click the chart, choose Indicators > Add indicator, open Custom and choose Pulling & Stacking Indicator.
- The first time, the Terms and Conditions window opens. Read them and click I accept the Terms and Conditions. Until you accept, the indicator draws nothing and the console does not open. If you click Not now, the window comes back the next time the indicator starts (when Quantower starts, after a settings change, or when you add the indicator to another chart). To read the terms again at any time, tick Show Terms and Conditions in the indicator's settings.
The lines are drawn in their own panel under the price chart, and the arrows on
the price chart. Once you accept the terms, the Pulling & Stacking Console
opens in a window of its own, with one tile per instrument. When it starts, a
tile shows PAUSED - checking your licence for the first seconds, while the
licence is checked, then WAITING FOR ORDER BOOK DATA, then WARMING UP. The order book has
no history, so the lines start from the moment you add the indicator, and with
the default settings the Resistance and Support band needs about 25 minutes of
data.
Market depth. Pulling and stacking is measured on the order book. If the
connection sends no depth, the tile's state line says No Level II depth received.
If the depth stops while trades continue, it shows ! ORDER BOOK DATA STOPPED.
Activate your licence
The licence key is in the email you get when you subscribe, and starts with lic_.
Until the licence is active, the chart stays empty and the console shows the
instrument as PAUSED, with the reason. Accept the Terms and Conditions first:
until then the tile shows the terms as the reason.
- Open the indicator's settings: click the gear beside the indicator's short
name on the chart (for example
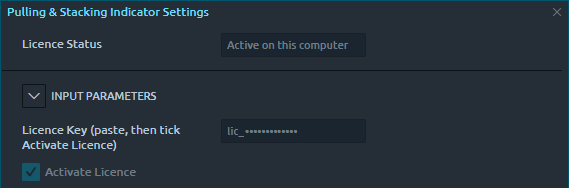
P&S 5m, after its Primary Window). - At the top, paste your key into Licence Key (paste, then tick Activate Licence).
- Tick Activate Licence. Quantower's settings window has no OK or Apply button: a change applies as soon as you make it, so the licence is activated straight away. Close the window with its X when you are done.
What you see afterwards:
- After a few seconds the console's Global notifications say
Licence active on this computer.and the lines start. - Licence Status, the read-only line at the top of the settings, shows the
state in a few words (
Active on this computer) the next time you open the settings; hold the pointer over it for the whole message. - While the licence is active on this computer, Activate Licence is ticked and greyed out, and Licence Key is greyed out and shows only the start of your key followed by dots. Adding the indicator to another chart shows the same: there is nothing to activate again.
If the key was not accepted, Licence Status says why (for example Key not found);
paste the key again and tick Activate Licence again. The key is stored for
this computer, not in the chart or a workspace. One key covers one computer,
whichever supported platform you use on it.
The indicator needs an internet connection: it runs only while the licence
server confirms your licence, and there is no offline period. Without a
connection it pauses, also when Quantower starts without one: the tile shows
PAUSED - could not reach the licence server. It keeps trying, and starts again
by itself once it connects, carrying on with the warm-up it had (after a long
pause the warm-up starts again). If the connection drops for a moment while the
indicator is running, it goes on for up to 2 minutes while it tries again
(Licence Status says Active, reconnecting), then pauses. The licence is checked
again once a day.
Release this computer
To move your licence to another computer, release it on this one first: open the indicator's settings, scroll to the Release This Computer group at the bottom of the list and tick Release This Computer. It applies at once (there is no OK button). The console then says this computer has been released and the indicator stops here; Activate Licence and Licence Key can be used again the next time you open the settings. Activate your key on the new computer. If the status line says the licence is active on another computer, release it there, then tick Activate Licence again. If you can no longer reach the old computer, write to contact@sigmantra.com.
The console
The console is one window for all your charts. Each instrument gets a tile with its headline, the 2, 3, 5 and 10 minute badges, a state line and a log. Alerts are set in the console: the bell on a tile for that instrument, and Global notification settings (top right) for every instrument: on or off (off by default), the threshold (3 standard deviations by default), the minimum time between alerts, the alert sound (with a Test sound button) and the text size. See the console and notifications.
Closing the console with its close box unticks Enable Pulling & Stacking Console, and the console stays closed, also after a restart, until you tick that box again on a chart. Console Always On Top keeps the console in front of Quantower's windows. It is one setting for the one console: the chart where it was changed last decides, and the other charts' boxes follow it. While a settings window is open the console steps behind it. Quantower's question when you close it can open behind the console: minimize the console to reach it.
Where your settings live
- The indicator's settings are saved with the chart in your Quantower workspace.
- The console's settings, the licence and your acceptance of the terms are
kept for your Windows user in
%LOCALAPPDATA%\StackSignal\PullingAndStacking. The folder keeps this name in every version of the indicator.
Every setting is described in the Quantower settings reference.
Platform notes
- What a settings change keeps. Quantower restarts the indicator on every change. The warm-up, the lines already drawn on this chart, the arrows and the instrument's log in the console are all kept. Changing Level Depth or Count Levels Entering The Depth is a different measurement, so the lines and the warm-up start again. Changing S/R Lookback Multiplier starts the band's warm-up again. The lines already drawn keep the settings they were drawn with; a line you switch on shows from the moment it is switched on.
- A Buy / Sell band (a chart in Buy / Sell mode, or Console Mode Buy / Sell on a Flow chart) starts when you choose it and warms over the full lookback (25 minutes at the defaults) before its readings are fully seeded.
- Crypto and other instruments traded in fractions. Where order sizes are fractional (for example bitcoin), sizes are counted in the instrument's lot step (with a 0.001 step, 1 BTC reads 1,000). The lines and the console's Passive and Aggressive numbers then read in those units instead of contracts; the shapes, bands, σ readings and arrows are unaffected.
- Market Replay needs Quantower's own paid licence. It replays trades and prices but not a recorded order book for the feeds tested, so in replay the indicator turns Passive Flow off and runs on Aggressive Flow; see indicator states.
Next: the flow decomposition · Quantower settings reference · the console
Chart images. The chart images on this site show the indicator's display on market data, to explain what it draws. They are not trading results or trade recommendations, and the risk and hypothetical performance disclosures above apply to them. We publish no trading performance. The full text is on the disclosures page.